This week, I revisited the Dear Data project for a second round of personal data visualization. Last time, I chose to depict how many dishes my household used within a week in a data-driven declarative pictograph. This time around, I chose to work with a conceptual-declarative visualization as a mind map of what my role as a freelance graphic designer entails.
Instead of collecting numerical data, I focused on a specific topic to break down into smaller parts. This visualization could be useful to individuals interested in freelancing and wondering what responsibilities are involved.
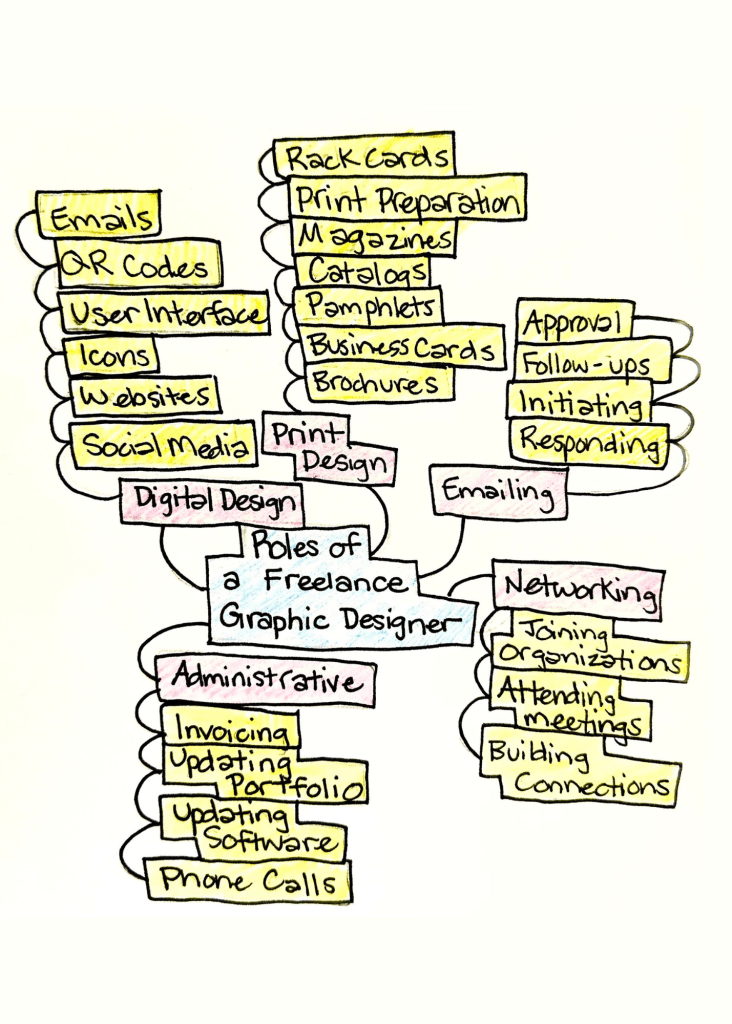
As I thought about what my typical day looks like, I began listing my five overarching responsibilities: print design, digital design, administrative tasks, emailing, and networking. Within each of these sections are more specific tasks that I run into on a daily basis. Before freelancing, I wasn’t familiar with how to invoice or where to begin when it came to gaining clients. I recommend that every aspiring freelancer should look into methods of invoicing and local networking outlets to better understand what they may experience after getting started.
Listing my daily responsibilities as a mind map helps me compartmentalize my tasks and give adequate attention to each section. Data visualization as a whole acts as a powerful tool for individuals and groups to simplify concepts, share information, and identify larger trends.
To learn about different visualization types, check out one of my previous posts!

Leave a comment